
Psychology Statistics – Research Methods
Psychology Statistics – Introduction
A lot of my students commented that they chose psychology courses or went into psychology related career because they do not like numbers. They were shocked when they realized that there is statistics (heavy content of statistics) in a psychology course.
In order to do well in psychology statistics, one will need to understand why it is important to study statistics. Statistics in psychology is studied to help students conduct research so that a certain theory that you come out with can be proven. For instance, if you were to tell people that depressed patients require soothing music to help them get out of suicidal thoughts, no one is going to believe you unless you carry out a research with proven data. That is when psychology statistics come into place.
In this first chapter, we will examine how the data characteristics and why they are important.
When we are collecting data, we need to ensure that the data are VALID and RELIABLE.
Psychology Statistics – Validity
Valid means that the data has to be useful, meaningful and measures what it is supposed to measure. There are different types of validity as follow:
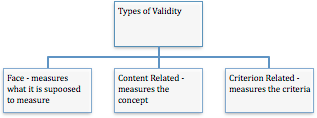
For instance, if you would like to measure the future career performance of a person, the face validity would have to encompass measuring his or her current academic results to predict the future performance. The content related validity would have to ensure that there are adequate items that measure future performance like results, leadership skills, social skills etc. Criterion related validity would have to ensure predictive and concurrent outcome. For instance, Full Scale Intelligent Quotient and Emotional Quotient tests measure the current performance (concurrent) of the student at school and can predict the future outcome (predictive) of the student in the working society.
Psychology Statistics – Reliability
Reliability measures the consistency of the data. For instance, if you agree that you are happy, you cannot agree that you are upset. That would have contradicted what the person is feeling. This situation usually arises when a person is not reading the questionnaire but is merely circling the response. We would have to take this data out if we are compiling a questionnaire data.
Research Methods
Conducting a research to prove what you believe in follows a process. The steps can be broken down a follow:
Step 1: Research question
Does music enables a depressed patient to drop the idea of committing suicide?
Step 2: Generate Hypothesis
Music is able to help a depressed patient get out of suicide thoughts
Step 3: Identify your constructs
- Music
- Suicidal Thoughts
Step 4: Come out with your variables
- Music – Listening to one piece of classical music once a day
- Suicidal Thoughts – Frequency of attempt suicide
Step 5: Collect data, tabulate it, measure validity and reliability of the data
Reliability of the data can be measured by Cronbach’s Alpha in some of the statistical software like SPSS. Other method of ascertaining reliability of the data is eyeball techniques to ensure that respondents are consistent in their answers. However, it might be difficult to work with large sample size.
Validity can be measured by factor loading in SPSS. Validity can also be measured by asking respondents after the research if the questions are clear, unambiguous and measure what it is supposed to measure.
Step 6: Decide the test to use
This one depends on the scale of measurement of the data type. There are generally 4 scale of measurement –> NOIR (Nominal, Ordinal, Interval Ratio)
Scale of Measurement – Nominal
Nominal data cannot be ranked and does not have a meaning. It is usually representative data or dummy variable. (variable where a number is used to identify a string. For instance, gender variable can have “1” to represent “male” and “2” to represent “female”. A lot of the people wonder why dummy variable is even necessary? Why can’t you just use “male” as the data set? Why must you set it to be 1? The reason is because any statistical software, Excel, SPSS etc will not be able to take in words for analytical purpose. Can you imagine dividing male by 5? You wont be able to do that. That is the reason why dummy variables are used instead.)
Example: I/C, gender, geographical area, races, religion, languages etc
Test that you can use – logistics regression
Scale of Measurement – Ordinal
Ordinal data can be ranked but the comparison is not in unit. For example, I cannot be saying a “small” size shirt is twice as small as a “medium” size shirt since “Small” “Medium” has different measurement for every single brands and shirt types.
Example: Apparel Sizes
Test that you can use – spearman ranking, chi square
Scale of Measurement – Interval & Ratio
Interval data can be ranked and the difference is accurate to units. For instance if I weigh 45kg, I am 10kg lighter than a person who is 55kg. Typically, we can put a number to the difference and we can add, subtract, divide and multiply the data. Interval data has an absolute zero that is we zero means something. For instance, zero degree refers to ice whereas ratio data has no absolute zero. That implies that zero means nothing. If we say that there are zero eggs, it implies that there are NO eggs.
Example of Interval Scale of Measurement: Degree, Survey responses (Strongly agree, agree…)
Example of Interval Scale of Measurement: Height, number of cars etc
Test that you can use – Pearson correlation, t-test, f-test, regression
Need help in your psychology statistics? Engage the best psychology statistics tutor in Singapore – SMS 9758-7925