
Microeconomics Concept- Demand and Supply
Demand and Supply
Microeconomics focuses on the theories of supply and demand. It helps businesses understand how much of a good or service they should produce and how much they should charge for this good or service.
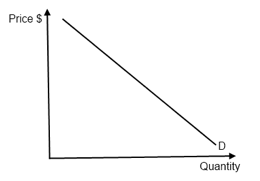
- Demand represents how much value consumers place on a good or service (their “valuation”). Demand curves plot this relationship as a function of Price and Quantity.
- Linear Demand Curves take the form: 𝑑𝑃 =𝐴−𝐵(𝑃)
- Log Linear Curves take the form: 𝑑𝑃 =𝐴(𝑃)−𝐵
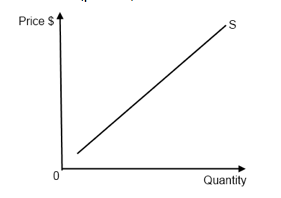
- Supply represents how much producers are willing to produce for the price of a good or service. Supply curves represent this relationship as a function of Price and Quantity.
- Cost Curves are formed of fixed (fc) and variable (vc) costs: 𝑐𝑄 =𝑓𝑐+𝑣𝑐(𝑄)
 |  |
| Demand Curve | Supply Curve |
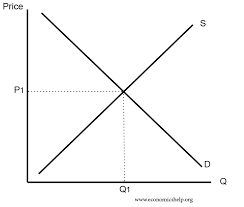
Market Equilibrium
Market Equilibrium is found at a Price and Quantity where:
𝐷𝑒𝑚𝑎𝑛𝑑 𝑑 (𝑃) = 𝑆𝑢𝑝𝑝𝑙𝑦 𝑠(𝑃)
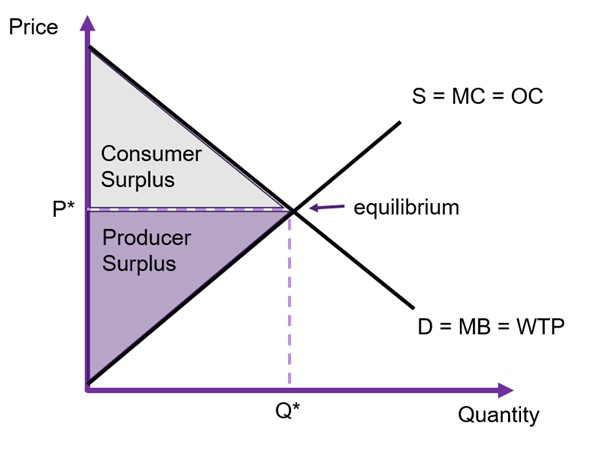
Market Equilibrium is Pareto Efficient: it is a state where economic resources are most efficiently distributed. I.e. The consumer surplus and producer surplus are at its maximum and there are no deadweight loss.
Need help in microeconomics concept? Engage us for economics tuition